At Yahoo!, grids running Hadoop have attracted a wide range of applications from a diverse set of functional groups. The workload submitted by each group is distinguished not only from others in the cluster, but its profile also changes as users gain experience with Hadoop. Users tune their jobs to consume available resources; some may circumvent the assumptions and fairness control mechanisms of the MapReduce scheduler, at the expense of more timid workloads.
Tracking, modeling, and mimicking this adaptive, complex workload is a prerequisite to effective performance engineering.
A Brief History of Gridmix
Until recently, most of our work has been based on the existing, de facto benchmark for Hadoop, Gridmix (and its enhancement Gridmix2). Gridmix consists the following parts:
- A data generation script that must be run once to generate data needed for running the actual benchmark.
- Several types of jobs in the 'mix'. The particular jobs varied slightly between Gridmix and Gridmix2, but examples include sorts of text data and SequenceFiles, jobs sampling from large, compressed datasets, chains of MapReduce jobs, and jobs exercising the combiner.
- Configuration files- either XML files or shell scripts- that permitted the operator to tune the number of jobs in each type and of each size.
- A driver that parses the configuration file, submits MapReduce jobs to the cluster, and (in Gridmix2) collects statistics for each job.
While running Gridmix as an end-to-end benchmark yielded many insights into framework bottlenecks in medium-sized clusters under a saturating load, it does not model the diverse mix of jobs running in our environment. On the contrary, framework improvements motivated by studies based on Gridmix often had ambiguous effects in production after showing dramatic gains in a test environment. Consider the following set of workload characteristics based on a two-day window of production (Figure 1):
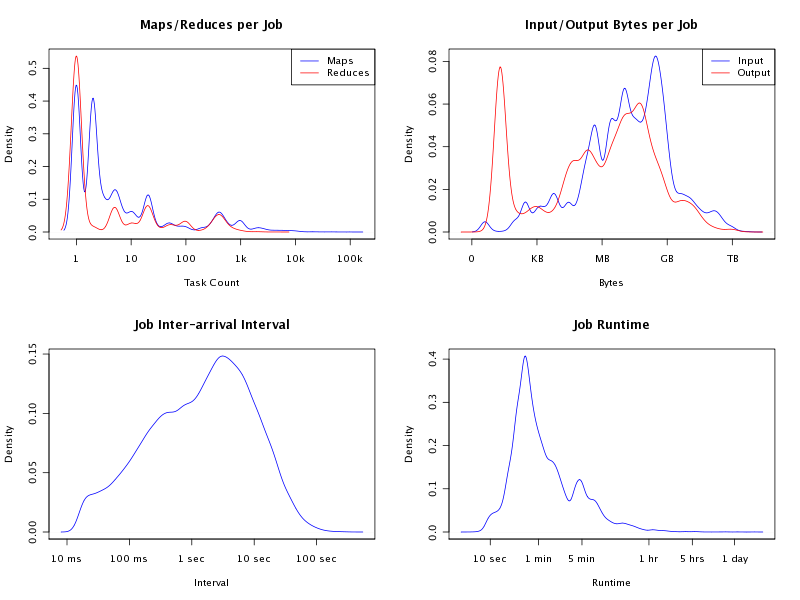 |
Figure 1: Production Workload Characteristics. |
Even with respect to these basic metrics, the 'real' load is considerably more complex than Gridmix. While there are few user jobs attempting to run hundreds of thousands of tasks, process many terabytes of data, or run for days, their presence on the cluster can skew metrics on throughput, utilization, and, most importantly, other users' experience on the grid. So it is critical to not only model the full range of jobs on the cluster, but also the co-incidence of jobs on the grid to accurately identify and reproduce load-related bottlenecks.
Gridmix3
The above observations motivated us to develop a new workload generator, Gridmix3 [1] , to narrow the following gaps between the existing benchmark suite and the load we're interested in:
- Task distribution: The number of tasks in a job varies widely in Yahoo! clusters, from a single task to hundreds of thousands.
- Submission interval:. Users are not nearly as predictable as the saturating benchmarks. We observe cyclic and bursty patterns that stress the JobTracker and the cluster in ways not seen in the synthetic load.
- Input dataset:. The data processed by Gridmix jobs are distributed over a small subset of the blocks in a system, with artificial hotspots and a distribution unlike what is measured in practice.
- User diversity: The JobTracker schedulers are far more interesting under multiple user workloads.
- Job complexity: User jobs are not the simple, I/O bound sorts of saturating benchmarks, pressing the low-level limits of the framework.
Given that our cluster workload is constantly evolving, it is impractical to manually calibrate our benchmarks to follow it and inaccurate to determine a job mixture based on a static snapshot. Instead, we elected to build a benchmark that can reproduce the workload by replaying traces that automatically capture essential ingredients of job executions.
The benchmark takes as input a job trace, essentially a stream of JSON-encoded job descriptions derived from artifacts collected on a cluster (such as job history logs and configuration files). For each job, the submitting client obtains the original job submission time, the memory allocated to each task, and- for each task in that job- the byte and record counts read and written. Given this data, it constructs a synthetic job with the same byte and record patterns recorded in the trace and submits each at a matching interval, "replaying" that job on the cluster. The synthetic job will generate a comparable load on the I/O subsystems in the test grid as the original did in production. Figure 2 compares the workload characteristics of a two-hour production trace and the trace of Gridmix3 replay. Gridmix does such a flawless job matching the workload characteristics that we can hardly distinguish the lines for Gridmix3 from the production workload for some of the graphs. However, Gridmix3 does run much faster than actual jobs due to the omission of the emulation of other job execution details.
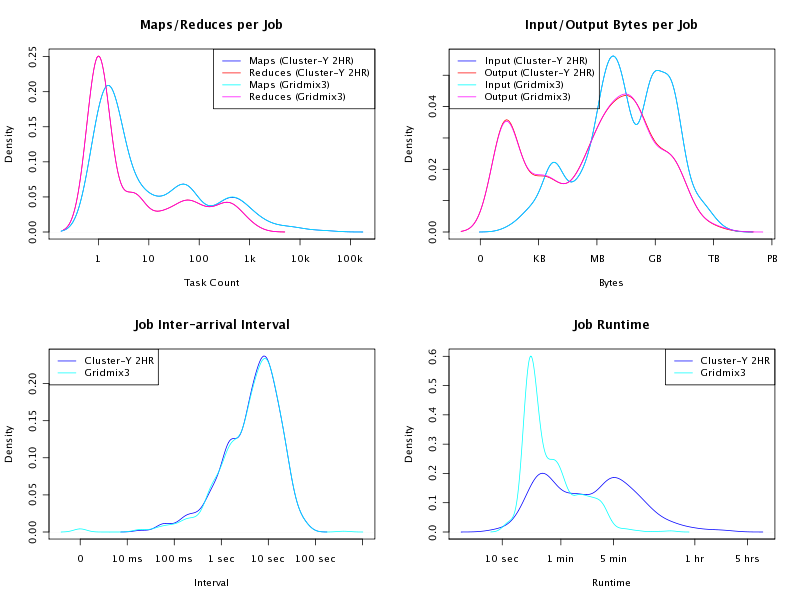 |
Figure 2: Comparing Workload Characteristics - Gridmix3 vs Production. |
As our models for synthetic jobs improve, Gridmix3 runs will capture interactions between jobs- for example, two I/O-bound tasks running on the same node- with accuracy sufficient for analysis and validation of code changes. We are in the process of extending the synthetic job mix to model CPU usage, memory, job dependencies, etc. as data become available. Since users often rely on core libraries and frameworks built on top of MapReduce, we also plan to include facilities for adding representatives of these to the job mix.
The Job Trace
The job trace is derived from job execution history logs collected by the JobTracker, through a tool called Rumen [3]. Rumen not only parses job history logs, it also provides several means to adjust the density of the trace to match the size of the testing cluster, such as sampling or trace overlay (a method for interleaving segments of job traces, so one may, for example, take two weeks from one cluster and combine them, capturing cyclic effects in the augmented load). Future work in scaling cluster workloads to smaller/larger clusters and extracting job properties from cluster artifacts will be integrated into this tool. Yahoo! is planning to release anonymized versions of traces from its production clusters for others to experiment with. The JobTracker simulator developed in collaboration of Yahoo! Research, Mumak [2] also uses these traces.
Where We are Today?
Gridmix3 is now an integral part of our Hadoop development process (Figure 3). It is running nightly on our internal automatic regression framework to catch performance regressions; it has also reproduced a load-related failure observed in production and validated its fix. We presented our preliminary results at USENIX FAST'10 as a 'Work-in-Progress'.
 |
Figure 3: Hadoop Development Workflow with Gridmix3. |
In conclusion, we believe that Gridmix3 will be a useful tool not only for Hadoop development and performance engineering, but also developers and researchers seeking to validate their hypotheses against real-world workloads. We also hope it will encourage collaboration and innovation in the Apache Hadoop community.
Chris Douglas, Hong Tang
Hadoop Performance Engineering, Yahoo!
References
- Gridmix3: git://git.apache.org/hadoop-mapreduce.git/src/contrib/gridmix/.
- Mumak: git://git.apache.org/hadoop-mapreduce.git/src/contrib/mumak/.
- Rumen: git://git.apache.org/hadoop-mapreduce.git/src/tools/org/apache/hadoop/tools/rumen/.